Overview
The basic idea is as follows
Todo
mention frame averaging
Todo
mention cylinder droplets
1D Density Profile
A 1-dimensional density profile in \(z\) is constructed for the substrate and liquid, identifying the extent of each.
The substrate is assumed to encompass the entire \(x-y\) extent of the simulation box, so all atoms are used. The droplet is assumed to be located at the \(x-y\) of the simulation box, so only atoms within a thin vertical cylinder are used to determine the droplet density.
The substrate density profile is used to locate the top of the substrate. All further z positions will be shifted such that the substrate top is \(z=0\). The droplet density profile is used to determine the \(z\) extent of the monolayer if this feature is desired.
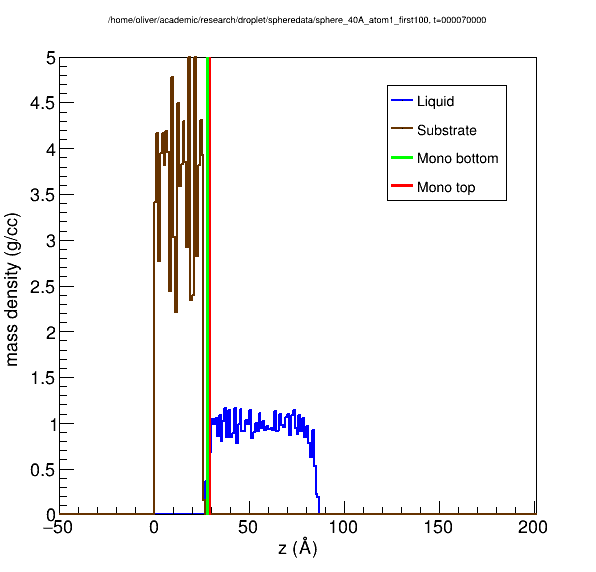
Figure 1
2D Density Profile
A mass density histogram is created from atom positions using equal-volume rectangular bins in the cylindrical \(r-z\) plane.

Figure 2
Todo
expand on this
Location of Boundary Points
In order to locate the liquid-vapor interface, we seek to find points on this histogram where the density is half the liquid density. To do so, we take each row and column separately as a one dimensional histogram of \(r\) vs \(\rho\) or \(z\) vs \(\rho\) for rows and columns respectively. The shape of each such 1d projection is expected to resemble a transformed hyperbolic tangent function. For each projection, we fit the function
and consider the fitted value of \(x_0\) (the location where \(\rho(x) = \rho_l/2\)) to be a point on the liquid-vapor interface.
Todo
Define parameters in above equation
Todo
Remove 4*
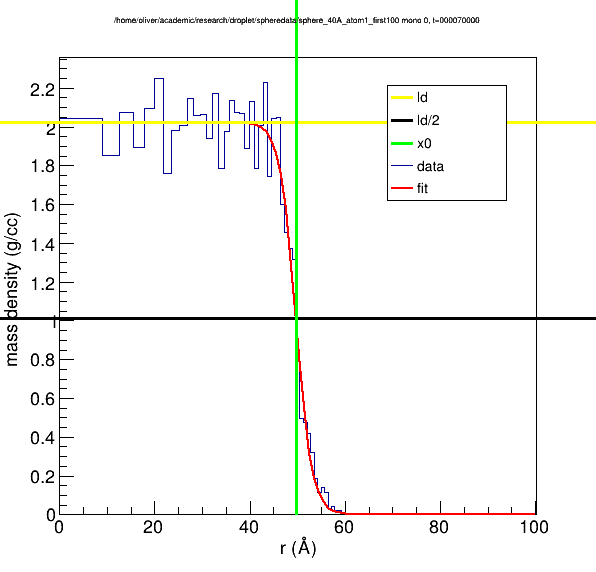
Figure 3
Calculation of Geometric Quantities of Interest
By repeating this for each row and column, we obtain a set of points which roughly define the boundary of the droplet in the \(r-z\) plane. We then mirror these points about the \(z\) axis in the \(r-z\) plane and fit a circle to the resulting set of points, whose center lies on the \(z\)-axis. The surface obtained by revolving this circle about the \(z\)-axis contains the approximate surface of the bulk of the droplet.
The geometrical quantities of interest are:
- Bulk radius (\(r_b\))
- Monolayer radius (\(r_m\))
- Bulk height (\(h_b\))
- Contact angle (\(\theta\))
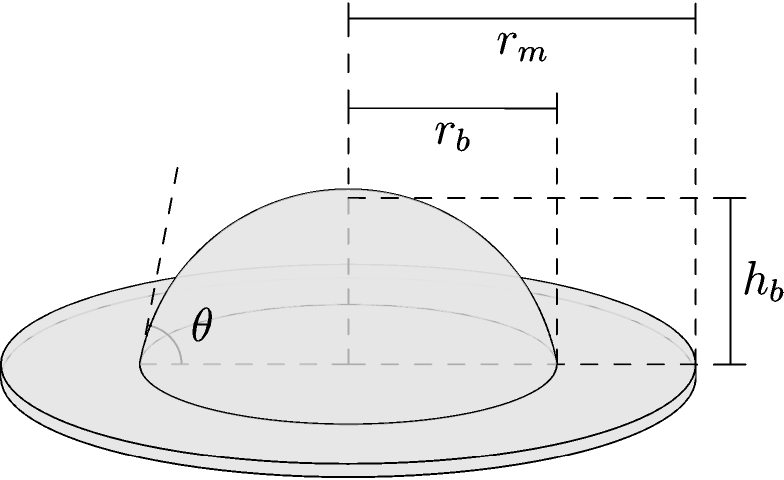
Figure 4
If monolayer calculations are enabled, a 1D histogram (\(r\) vs \(\rho\)) is created and filled with atoms within the \(z\)-extent of the monolayer determined from the 1D density profile. While the molayer density tends to be higher than the bulk density, the same hyperbolic tangent fitting procedure can be applied to calculate the monolayer radius, defined as the radius where the monolayer density is half of its density towards the center (although it may also be defined as the radius where the monolayer density is half of the bulk liquid density).
Then, the plane which defines the upper surface of the monolayer is intersected with the circle defining the bulk boundary in the \(r-z\) plane. The radius at which this intersection occurs is defined to be the bulk radius. The angle the tangent line to the circle at the intersection makes with the \(r\)-axis (rotating the tangent line in to the droplet) is the contact angle. The positive \(z\)-value of the circle at \(r=0\) is the bulk height.
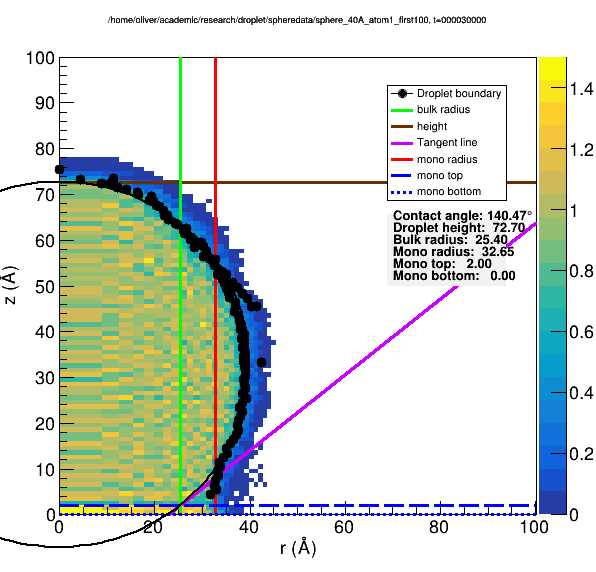
Figure 5
If monolayer calculations are disabled, then the top of the substrate is taken to be the plane of intersection rather than the top of the monolayer. If no substrate atoms are present, this interface can be specified manually.
Todo
Link to this option.